


Live
Incidents
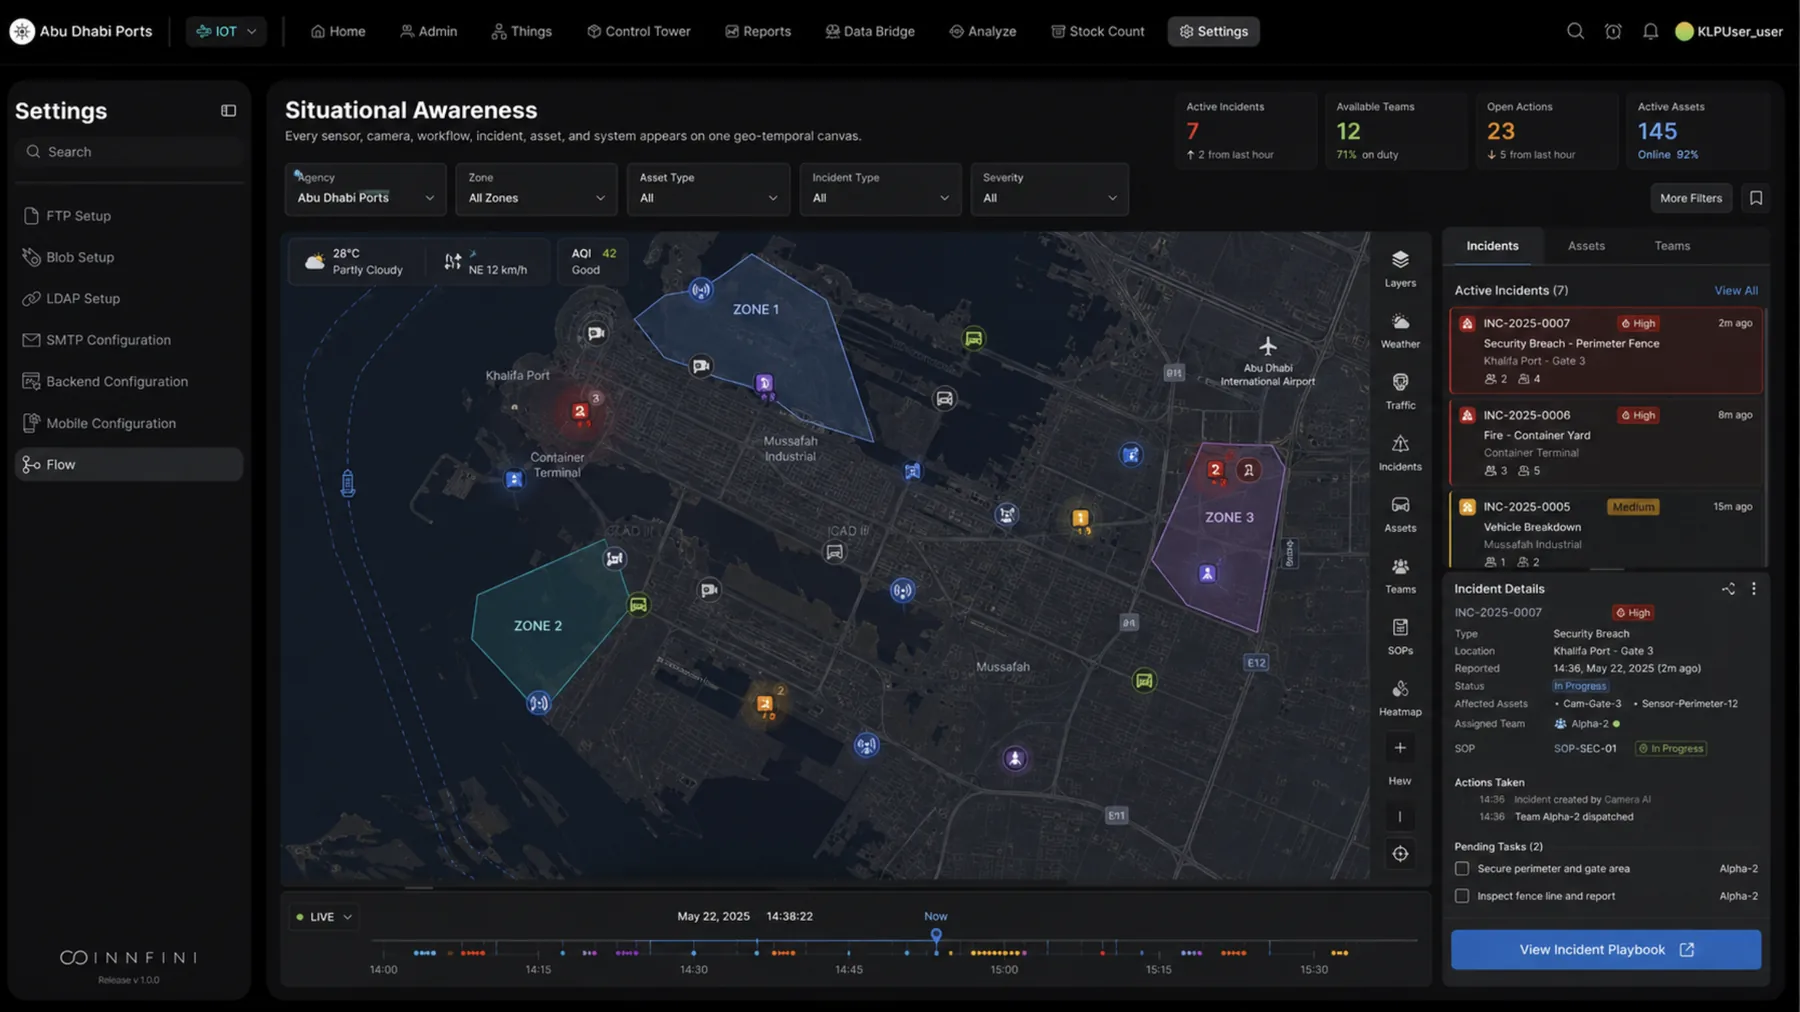
Live incident markers with severity, status, owner, SOP and team assignment.
Innfini creates a unified geo-temporal operating picture across every real-time data source. Incidents, sensors, cameras, assets, field teams and SOPs are linked to time, location, status, severity, ownership and operational context — so operators always know what is happening, where, who is affected, and what is being done.
Each Innfini screen below is an illustrative scenario on one riverside city — the same map and the same event model from the common operating picture to a single incident, its replay and a port terminal.
Police, fire, hazmat and port security each run their own systems. The common operating picture fuses them: three active incidents across the riverside, downtown and port districts, each with its camera cone, its assigned unit and its place on a shared event timeline. Filter by agency, zone or severity and everyone is looking at the same truth.
A collision on the bridge is detected by Bridge Cam B-07. Innfini links the camera, logs the assignment to Engine-12 with SOP TR-04, and shows the route from Station 12 — so the operator, the station and the field crew see one incident record, not three. Closure stays pending until the field update arrives.
Time-aware means every layer can be rewound. Event playback shows the same map at 14:10 when the vehicle incident was detected, at 14:18 when the response was assigned and the ambulance route lit up, and at 14:32 when it was resolved. Scrub the timeline and the state of every unit, camera and marker follows.
Situational awareness is not only a city product. Around a terminal the zones become Zone 1 · Berths, Zone 2 · Yard and Zone 3 · Gate; an equipment alert on a reach stacker in the yard is detected, reviewed with Yard Cam 04 and assigned to maintenance with a next action — the same detected → reviewed → assigned flow, on a port map.
Live incident markers with severity, status, owner, SOP and team assignment.
Geo-pinned camera nodes — click for live stream, recent detections and triggers.
RFID, BLE, GPS, environmental and IoT signals fused into asset-level positions.
Vehicle, patrol, hazmat and crew locations with skill, role and SLA timers.
Operational zones, geofences and SOP boundaries — drawn live on the map.
Critical / High / Medium / Low color-coded for at-a-glance triage.
Scrub backwards through the day, hour or minute. Replay any past picture.
Agency · zone · asset type · incident type · severity — combinable, savable.
Stack weather, traffic, air-quality and environmental layers on top of the operational picture. Same canvas, more dimensions.
Every agency, system and feed on one canvas — no swivel-chair.
Severity, SOP and team availability surfaced at the marker — assign in one click.
Scrub the timeline to see exactly what was true at any past minute.
Same map, same layers — from a single building to a multi-agency district.
Situational Awareness turns the chaos of multi-source ops into a single operating picture — one map, every layer, every signal, full time travel.
A live walkthrough with our solutions team — your maps, your sensors, your incidents, your SOPs.